City Statistics
City Statistics
City Statistics shows statistics about a selected urban area and can be used to change the name of it. An urban area is a city, town or village; below the term city is used for any urban area.
Each city has its own Town Hall around which it grows. Transportation of passengers and mail furthers growth, which involves roads being built or taken over by the
public service player; new city buildings and
industries appearing; and city limits extending.
Click on a Town Hall in game-view with the
Inspection Tool or a city listed in
City List to open
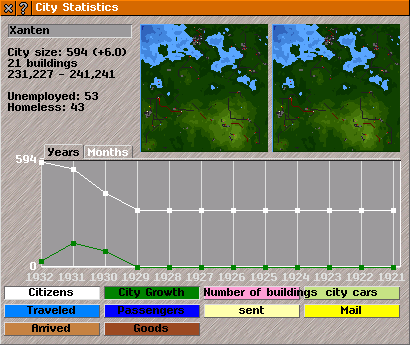
City Statistics. Here you can see and modify the name of the city, some statistics, two mini-maps, and a graph where you can display the development over time for certain factors pertaining to the city.
Name: the assigned name of a city, town or village appears in a box at the top of
City Statistics.
Names of such urban areas are used to create names for
stops within the city limits.
To change the name simply click on the box and type in a new name.
{Tip: Use
[!] to toggle the display of the name of a city above the Town Hall in game-view. See readme_citylist.html (in ...simutrans/text/) for more information on how city names are generated}.
Under the name box are given some basic city statistics:
City size: its current number of citizens. The recent increase in population is shown in brackets.
Buildings: number of city buildings (residential/commercial/industrial) in the city.
Map co-ordinates: indicating the boundary of city limits (these will change as the city grows). The first pair of values indicates the top left corner, and the second the lower right corner. As cities grow, city limits may overlap.
Current numbers of unemployed and homeless inhabitants of the city. These will increase when the city expands its limits, and decrease when new city buildings are erected.
The balance between these counters determines which type of city building (residential/commercial/industrial) will be constructed.
The Allow city growth button allows you to toggle city growth on and off.
Mini-maps of the game world in
City Statistics show the destinations of passengers and mail generated within the city as coloured dots.
The right hand mini-map shows values for the current game calendar month, and the left one for the last game calendar month. The colour of each dot indicates if the destination can be reached or not:
- yellow dot: there is a route and an uncrowded
stop to start journey (happy face shown in Stop Information).
- dark orange dot: there is no route to this destination.
- orange dot: the stop at the start of the journey was overcrowded (unhappy face in Stop Information). There is no check for a route if station is overcrowded.
Below the mini-maps there is a graph showing statistics for the city.
On the y-axis quantity is shown and on the x-axis time.
Click on graph index tabs to change the scale of the x-axis:
Years: shows annual values for last 12 game calendar years.
Months: shows monthly values for last 12 game months
By clicking on the graph option buttons, you activate and deactivate the curve for each given button. When a button is selected it is shown indented.
The curves match the colour of the corresponding option button:
Citizens: The number of people that live in the city
City growth: Changes in population (dependent on city size and transport service provided for passengers and mail).
No. of buildings: How many city buildings there are in the city.
City cars: How many city cars have been generated
Trips: How many passengers that have entered the transport network (shown as a
happy face in Stop Information)
Passengers: The total number of passengers generated in the city.
Sent mail: Mail that has entered the transport network
Mail: Total number of mail generated in the city.
Supply:Number of times there were goods in storage at city factories
Goods:Number of times storage of city factories have been checked.
{Tip: Settings related to cities can be changed in simuconf.tab and cityrules.tab}.